OYF Impact Assessment and Evaluation Methods

About Our Assessment & Evaluation Methods
This page describes the OYF’s assessment methods. For a summary of over a decade of impacts and youth outcomes from OYF’s work, see the OYF Impact page.
The OYF Network of place-based partnerships uses multiple data and evaluation approaches to drive improvement and understand youth outcomes and impacts. Aspen FCS’s OYF member communities work together to create and use these data sources to drive towards better outcomes for young adults in communities, and improve collaborative’ capacities, and improve local systems.
Information Sources Used by OYF Collaboratives to Assess Impact
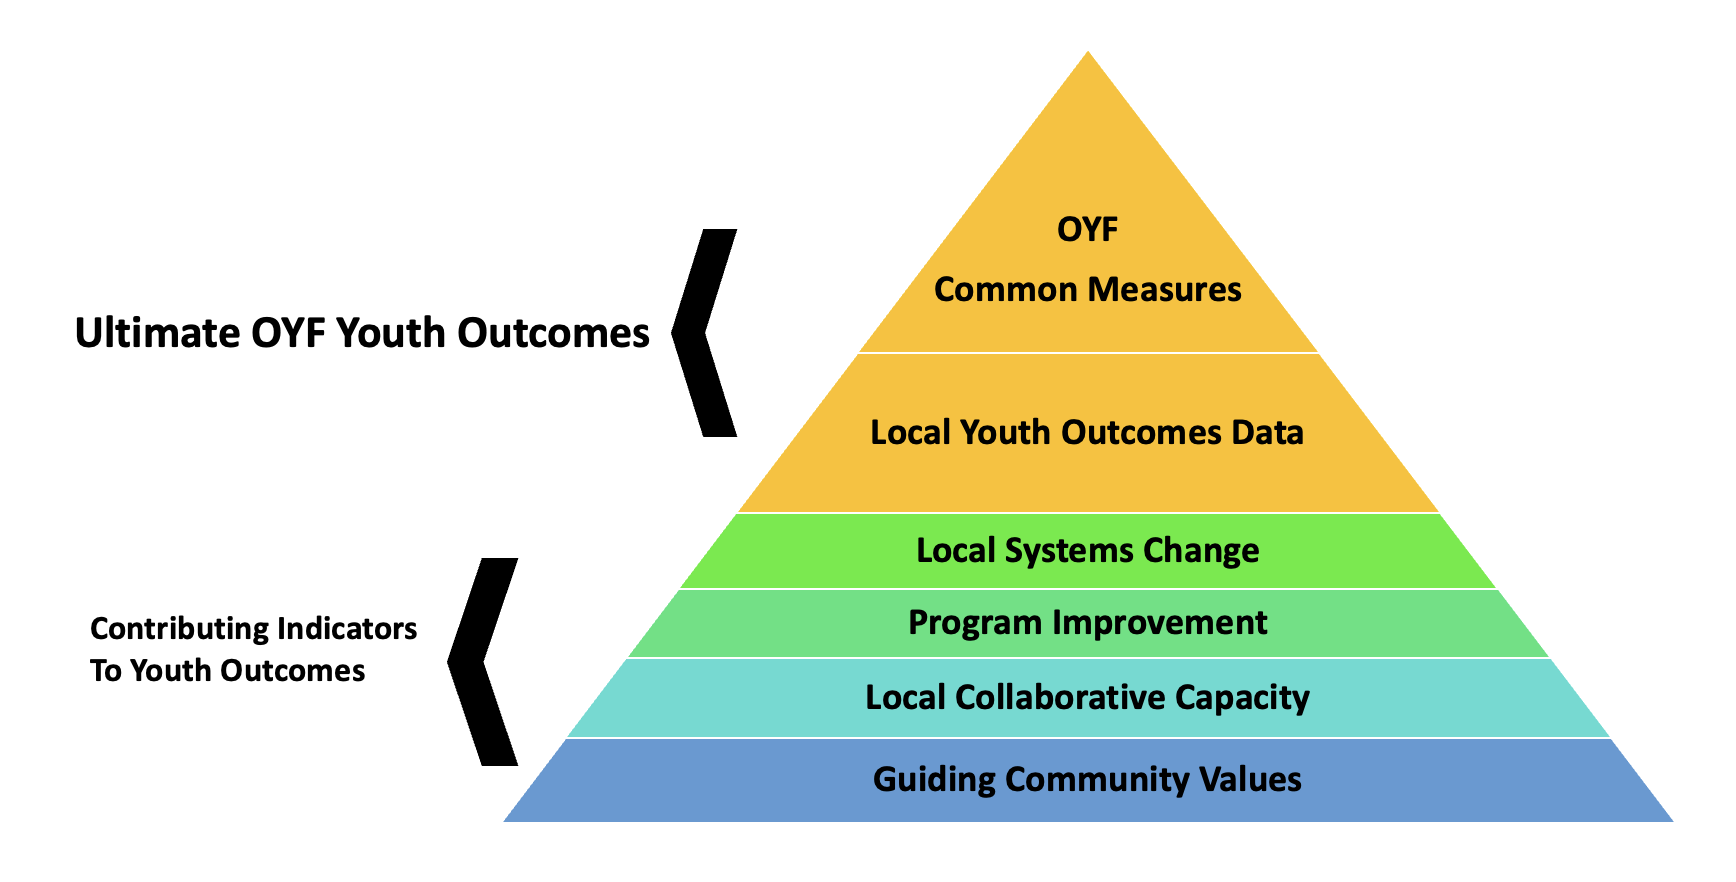
OYF Common Measures: the four Common Measures are run annually and given to sites, describing community-wide population level stats on the numbers of OY and their education and workforce attainment status. Sites set future targets for improvement against the Common Measures. Sites supplement these measures with other local statistics as well.
Local Youth Outcomes Data: OYF sites collect information from direct services providers who are collaborative members, to understand the numbers of OY being served by programs, and also the outcomes being accomplished – disaggregated by race and other demographics when possible.
The Opportunity Youth Forum’s Approach to Change
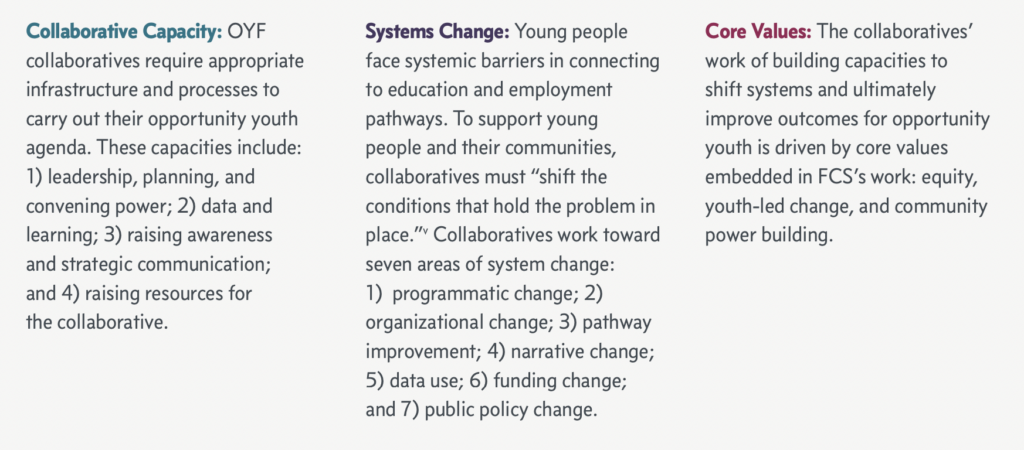
Annual OYF Self-Assessment: this survey asks questions about the characteristics of the collaborative, the collaboratives capacity in 4 domains, the collaborative’s impact on 7 kinds of systems change, and their work in 3 core values areas that are essential to this work. Collaboratives can track their progress over time, and compare themselves to peers.
More detail on each of these assessment and data tools follows.
- OYF Common Measures of youth outcomes
Opportunity Youth have historically been difficult to count, as they are defined as a group which does not appear in either of two data sets – those in an educational program and those not working. With the OYF Common Measures, however, we can annually measure, in a uniform way across all OYF collaboratives, for the unique geographic area of a OYF collaborative, four kinds of OY disconnection.
The four measures are:
- Overall community disconnection rate: The rate of young people disconnected from both work and school (i.e., opportunity youth).
And three additional rates, that break down the overall community disconnection rate, into segments by educational attainment:
- High school disconnection rate: The rate of young people without a high school diploma/GED and not working who are disconnected from high school.
- Postsecondary disconnection rate: The rate of young people with a high school diploma/GED but without a postsecondary credential, who are disconnected from postsecondary education and not working.
- Workforce disconnection rate: The rate of young people with a postsecondary credential, but not enrolled in postsecondary, who are disconnected from the workforce.
One important attribute of the Common Measures data is that it is disaggregated by various demographic variables, such as race, gender, income, etc. We are also able to disaggregate it by other OY-pertinent variable such as having a child in the home, nativity, and more. The Forum for Community Solutions provides the Common Measures detail to each OYF member as the underlying data becomes available as a benefit of network membership, typically annually, in partnership with our assessment provider Equal Measure.
Each community receives a detailed data report, which it can use to track progress, set future goals, understand which parts of the OY population are increasing, understand OY characteristics to inform program-level design, and much more.
More on the Common Measures can be found here.
- Local Youth Outcomes Data
Established OYF member collaboratives are asked annually to collect program-level data from collaborative partners who work directly with OY. Such partners typically include CBOs, school districts, colleges, workforce intermediaries, etc.
The partner data collected includes:
OY Outputs: the numbers of OY and youth at risk of disconnection being served by programs. Includes breakdown by race and gender when possible.
OY Outcomes: of the numbers being served, the numbers of outcomes being achieved, in the last year, by programs; this includes major outcomes such as:
- Receiving a High School credential
- Attaining employment
- Attaining an internship or apprenticeship
- Attaining a college credential
We also request this data to be broken down by race and by gender when possible.
- OYF Annual Self-Assessment
The Opportunity Youth Forum place-based partnerships network is regularly assessed for progress and impact by our independent evaluators, Equal Measure.
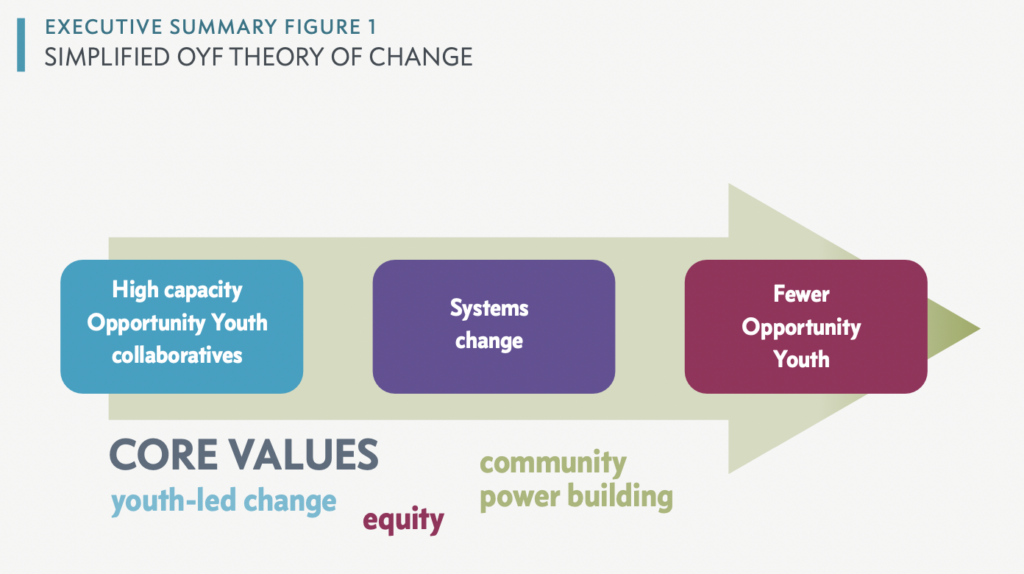
This assessment is based on our theory of change for OYF place-based collaboration, which is that to attain the goal of reducing the numbers of opportunity youth, localities need to have collaboratives with strong capacities that are focused on improving systems meant to support young adults, all embedded in a community that values equity and shifting power imbalances.
Within the assessment’s three main domains are 14 different sub-domains, which the assessment looks at in great detail; over three hundred questions are asked annually in the assessment survey.
After years of these annual assessments, we have clear evidence that higher collaborative capacity is linked to increased systems changes, and further, we have preliminary evidence that higher rates of systems changes are linked to improved youth outcomes (decreased disconnection). See the 2024 OYF Annual Assessment for more information.
An important aspect of the Annual OYF Assessment is the return of data back to the contributing OYF members. Within 2 months of completion of the survey, OYF member receive back a detailed report which includes their own responses, and summary information on how they scored on the three major domains, as well as their scores within the 14 individual sub-domains in the survey. Additionally, each individual site is show how their scores have trended across time. And in addition, each site is shown their current year’s scores against the network-wide average, and also against a peer-group of OYF members (for example, a more mature urban site would see its data compared to other mature urban sites).
Summary findings, of improvements across the entire OYF network, from the annual OYF assessment reports, can be found here: