OYF Common Measures
The Common Measures include opportunity youth outcomes that all OYF members track.

The OYF Common Measures are how we measure youth outcomes across OYF communities, for our whole network and for partnerships individually, and how we track progress against our network-wide goal of reducing youth disconnection by 50% by 2033.
A Uniform Way to Track Opportunity Youth
Opportunity Youth have historically been difficult to count, as they are defined as a group which does not appear in either of two data sets – i.e. they are those not in an educational program and not working.
The data source we use to determine this ‘double’ disconnection is the US Census Bureau’s annual American Community Survey, which is 1) the source of the most accurate estimates of both education and workforce participation available for young adults; 2) consistent across all US communities and time; and 3) available annually.
In 2019, OYF’s independent evaluators Equal Measure worked with OYF collaboratives to develop more detailed measures that move beyond identifying simply the rate of disconnection from school or work. These measures, collectively referred to as the OYF Common Measures, utilize the American Community Survey data and allow us to capture the traditional disconnection rate, as well as the nature of that disconnection. These metrics provide greater clarity on how communities can prevent and support youth disconnection while tracking community-wide progress on closing the gaps of disconnection from high school, postsecondary education, and the workforce.
The measures are:
- Overall community disconnection rate: The rate of young people disconnected from both work and school (i.e., opportunity youth).
Then, within the overall community disconnection rate, we divide all the young people who are not working by level of educational attainment:
- High school disconnection rate: The rate of young people without a high school diploma/GED and not working who are disconnected from high school.
- Postsecondary disconnection rate: The rate of young people with a high school diploma/GED but without a postsecondary credential, who are disconnected from postsecondary education and not working.
- [post-college] Workforce disconnection rate: The rate of young people with a postsecondary credential, but not enrolled in postsecondary, who are disconnected from the workforce.
Technical Details: More information on the process used to pick the ACS as the data source, and other details of the process can be found in this publication. If you are interested in the specific technical methods used to derive the Common Measures from ACS data, you can find that in this publication.
Example Results from Common Measures Data
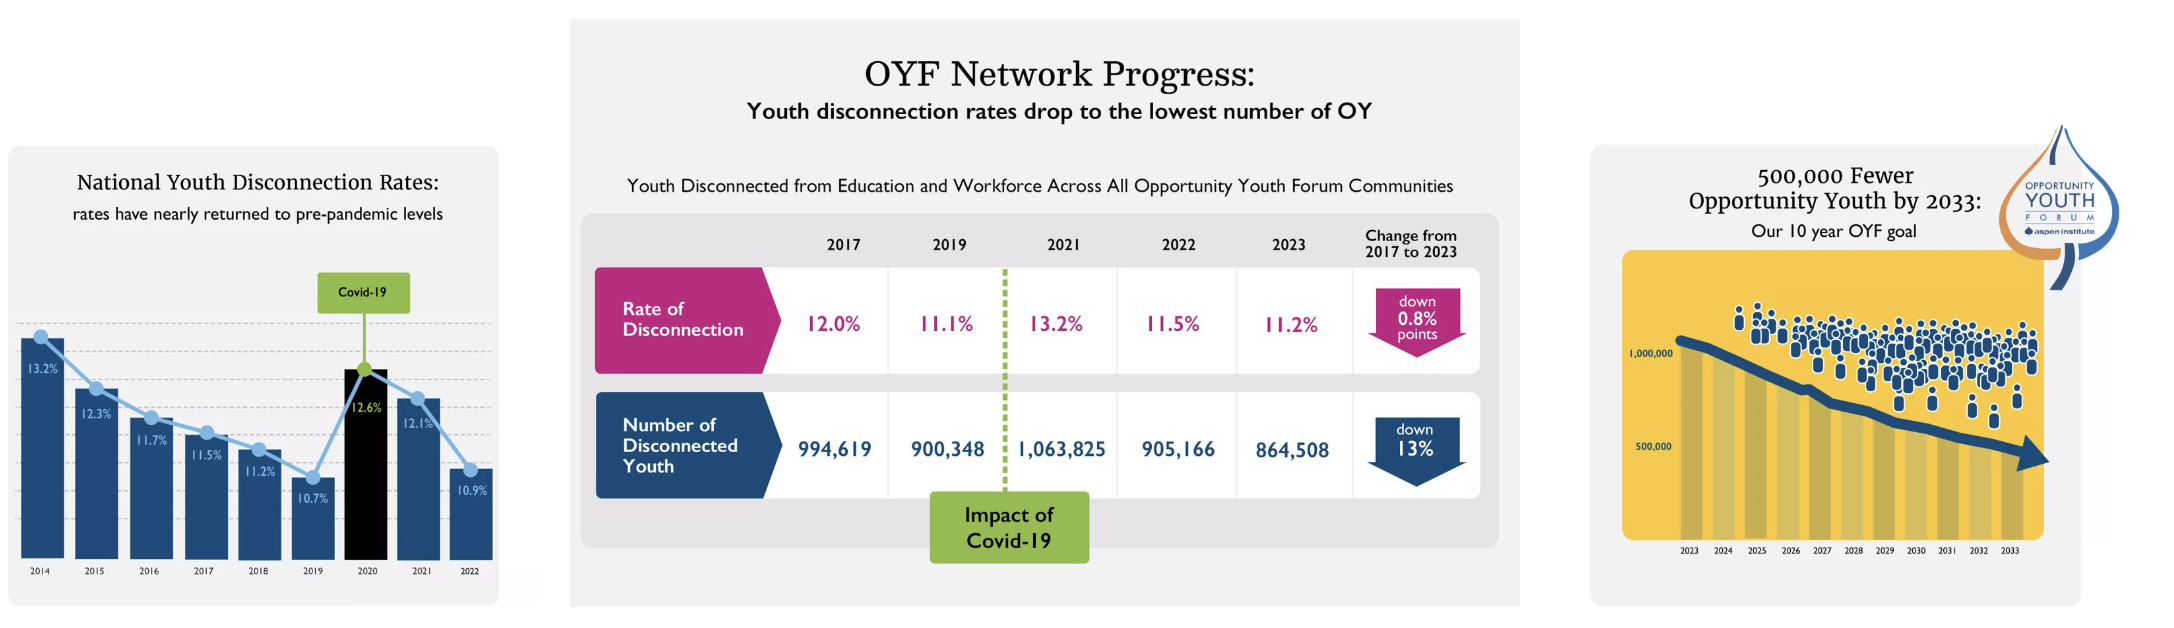
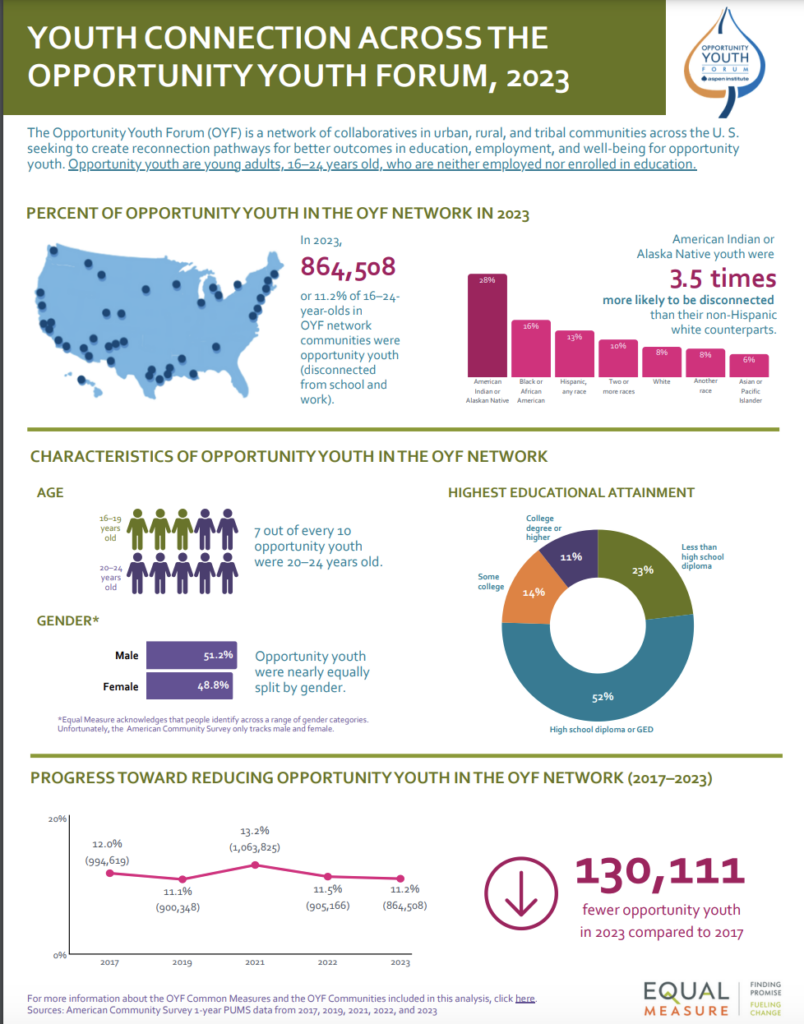
This infographic summarizes the state of the Opportunity Youth Forum Common Measures for 2023 based on the latest available data. Key network-wide trends include the following:
- In 2023, there were 130,111 fewer opportunity youth compared to 2017. A total of 864, 508 or 11.2% of 16-24 year olds in OYF network communities were opportunity youth.
- American Indian and Alaskan Native youth are 3.5 times more likely to be disconnected than their non-Hispanic white counterparts in 2023
- In 2023,over half (52%) of Opportunity Youth obtained a high school diploma. And nearly 70% of Opportunity Youth were between 20 and 24 years old.
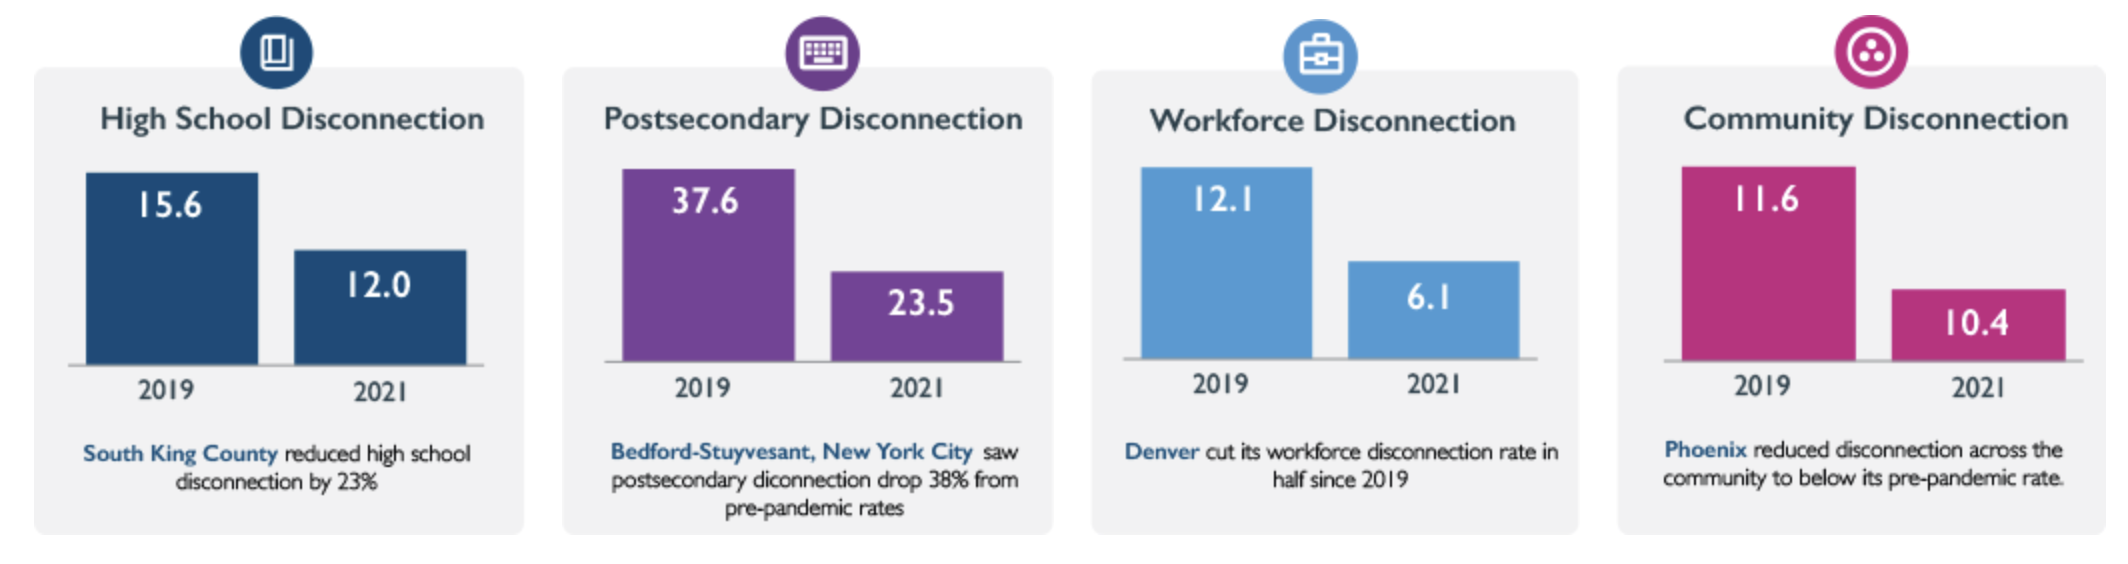
Additionally, at the collaborative level, the Common Measures can be used to understand local trends. OYF collaboratives are improving youth outcomes and increasing opportunities and connecting young people to pathways toward economic mobility. Many are defying national trends and seeing disconnection rates that are below pre-pandemic levels per the OYF Common Measures, as seen here:
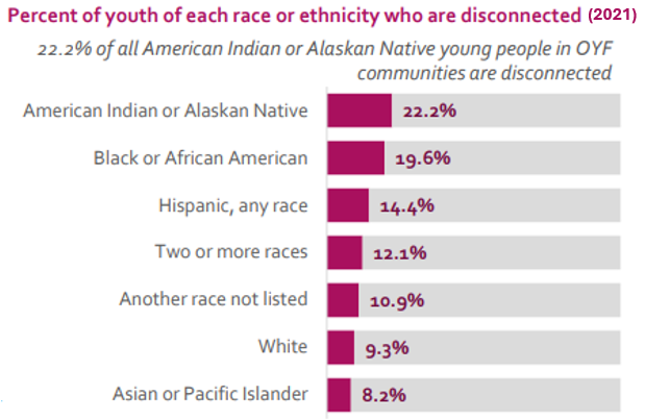
Disaggregation
One important attribute of the Common Measures data is that it can be disaggregated by various demographic variables, such as race, gender, and income. Disaggregation allows collaboratives to monitor equity gaps and apply targeted supports to priority populations.